
Executive summary
The pace at which places gain or lose population can reveal much about their overall economic health. Growing populations often mean an expanding economy with more potential customers and workers, while slow growing or declining populations may indicate a struggling economy that leads workers to explore employment opportunities elsewhere. The U.S. Census Bureau released its 2020 population estimates in May 2021 and these estimates allow us to examine the population change that occurred over the past year and the past decade.
These estimates show that between 2019 and 2020, Missouri grew by 0.2%, adding over 11,000 net new residents. The state grew at half the national growth rate (0.4%), but was largely consistent with many Midwestern and neighboring states. This population growth, however, has occurred unevenly throughout the state:
- Springfield (0.8%) and Columbia (0.7%) were Missouri’s fastest growing metropolitan statistical areas (MSA).
- The Kansas City, MO-KS MSA grew slightly faster (0.5%) than the nation, while growth in the St. Louis, MO-IL MSA (0.0%) was flat.
- The Jefferson City (-0.5%) and St. Joseph, MO-KS (-0.6%) MSAs lost population during this time.
- Overall, 62 of Missouri’s 115 counties (including St. Louis City, a county-equivalent) lost population; many of these counties were in Southeastern and Northern Missouri.
Examining population trends over the past decade offers stronger insight into the long-term population trends shaping Missouri. Since 2010, many of Missouri’s metro and nonmetro areas have not kept pace with many other parts of the country. As a whole, Missouri’s metro counties grew at a slower pace than the nation, and in aggregate the state’s nonmetro counties declined at a faster rate than nonmetro counties nationwide. Only 11 of the Missouri’s 115 counties, grew faster than the nation’s annualized growth rate. 78 of Missouri’s 115 counties (68%) had fewer residents in 2020 than they had in 2010; 64 of those counties were in nonmetro areas. The most substantial losses, in an absolute sense, occurred in St. Louis City and St. Louis County, the Missouri Bootheel, and in the St. Joseph area.
Two primary factors—migration (domestic and international) and natural change (births minus deaths)—drive population growth and decline. Overall, the state’s 11,000 net new residents in 2020 marked the smallest annual increase in the past ten years. At the beginning of the decade, Missouri averaged 18,000 to 20,000 more births than deaths, but over the second half of the decade the state averaged only 10,000 to 12,000 more births than deaths. During this latter part of the decade, the diminished rate of natural increase was offset, in part, by positive gains from international migration. Although improving, Missouri experienced net domestic out-migration throughout the decade.
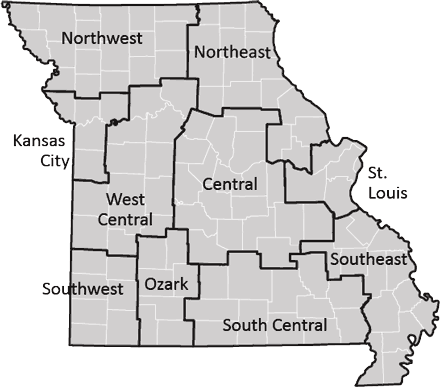
Given the unevenness of Missouri’s population growth, it is important to recognize how trends differ across workforce regions, as defined by the Missouri Economic Research and Information Center.
Summarizing population growth 2010–20:
- Central Region: The Central region’s annual growth slowed over the course of the decade due to slower natural change and international in-migration. Boone County (Columbia, MO) drove much of the region’s growth.
- Kansas City Region: Over the past decade the Kansas City region reversed a key demographic trend by attracting more domestic migrants than it loses. Platte and Clay counties were two of the state’s fastest growing counties.
- Northeast Region: Most of the Northeast counties lost population due to net domestic out-migration. Starting in 2016, the region’s overall population grew primarily as a result of the growth of Lincoln and Warren counties.
- Northwest Region: The Northwest region lost almost 5% of its population since 2010 due to net domestic out-migration and negligible natural increase. Andrew County was the only gain to gain population between 2010 and 2020, and DeKalb, Holt, Sullivan and Atchison counties lost substantial population during this period.
- Ozark Region: The Ozark region represents one of the state’s consistent growth regions, and it grew over 8% overall between 2010 and 2020. If current trends continue, Greene County will soon become Missouri’s 4th largest county-equivalent, surpassing St. Louis City.
- South Central Region: The South Central region is Missouri’s least populated and all 12 counties lost population 2010-20 as a result of domestic out-migration and natural decline.
- Southeast Region: In spite of population growth around Cape Girardeau, the Southeast region lost 7,800 residents, as a result of net domestic out-migration and natural decrease. Some of Missouri’s most significant population loss occurred in the Bootheel.
- Southwest Region: Although impacted by Joplin’s 2011 tornado, the Southwest region has experienced steady growth since 2013. Most of this growth has occurred in the Joplin MSA.
- St. Louis Region: The St. Louis region’s suburban counties (e.g., St. Charles) are some of the state’s fastest growing, but St. Louis City and St. Louis County have lost population over the past two decades. The suburban gains often occur at the expense of the urban core, but overall the region experienced continued net domestic out-migration.
- West Central Region: Throughout the first part of the past decade the West Central region mirrored many other nonmetro areas with shrinking populations. However, the region has experienced positive population growth every year since 2016, as smaller cities like Warrensburg and Sedalia grew and Truman Lake attracted retirees and second home buyers.
These population trends have long-term implications for different regions. Growth regions will want to ensure that they continue to attract and retain people of all ages. Regions that attract people but have older populations will need to find ways to grow their working age population in order to support and strengthen their workforce. Areas with chronic out-migration must further address the reasons why people leave, and find ways to attract former residents to return.
Demographic trends can shape growth
The pace at which places gain or lose population reveals much about their overall economic health. If a county or region grows faster than the state or the nation, it is likely generating sufficient economic opportunities to attract new residents and retain existing residents. Growing populations create more potential customers and workers for area businesses, and growing communities are also more likely to have expanding tax revenues to support public services and local schools. By contrast, slower growing or declining populations may indicate a struggling economy, which leads workers to explore employment opportunities elsewhere. Moreover, communities with significant out-migration and aging populations are more likely to face diminished tax bases and the threat of consolidated schools.
The U.S. Census Bureau’s Population Estimates Program annually estimates population for states, counties and incorporated places (e.g., cities, towns, boroughs, etc.).1 These estimates use information related to births, deaths, federal tax returns, Medicare enrollment, and immigration to provide an annual update to the decennial census’ base counts. These estimates cover population changes that occur between July 1 and June 30 — the recently released 2020 version estimates the population change between July 1, 2019, and June 30, 2020.2 In addition to shedding light on important demographic trends, the estimates also play a key role in many federal funding allocation decisions.
This analysis reviews the population trends shaping Missouri over the past year and the past decade. It begins by reviewing the population changes that occurred between 2019 and 2020, between Missouri and other Midwestern and neighboring states, as well as within Missouri. However, this only provides a one-year snapshot. The recently released 2020 population estimates also enables us to better understand the last decade’s population trends and how they influence the trajectory of the state and its regions. Specifically, the analysis highlights the extent to which the state and its regions have been shaped by natural change (i.e., births minus deaths) and both domestic and international migration.
Finally, the brief will lay out several key implications of these trends.
Missouri grew last year, although at a slower pace than the nation
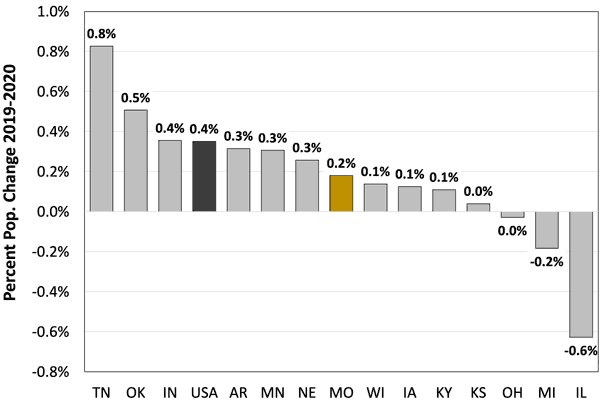
Figure 1. Annual population change in select states, 2019–20. (Source: U.S. Census Bureau, Population Estimates Program, V2020)
In 2020, Missouri had an estimated population of 6,151,548 making it the nation’s 18th largest state, behind Indiana and ahead of Maryland. Between 2019 and 2020, Missouri added over 11,000 net new residents, thereby growing 0.2% — a growth rate half that of the nation (0.4%). Over the past year, Missouri was neither fast growing like Tennessee nor shrinking like Illinois, but as Figure 1 shows, its relatively slow growth rate was consistent with many Midwestern and neighboring states.
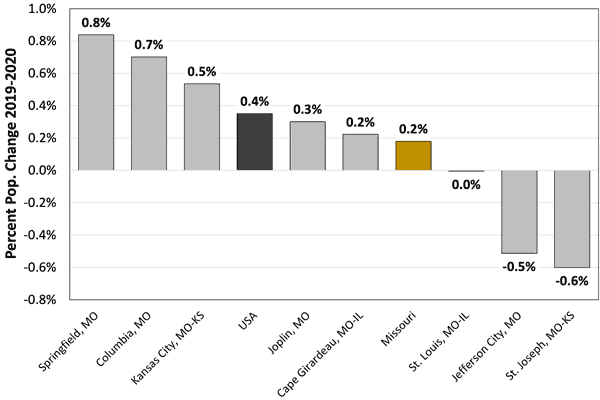
Figure 2. Annual population change in Missouri metro areas, 2019–20. (Source: U.S. Census Bureau, Population Estimates Program, V2020)
Figure 2 shows that this population growth has been uneven throughout the state and its metro areas.3 Springfield and Columbia — Missouri’s third and fourth largest metro areas — grew almost twice as fast as the nation at 0.8% and 0.7%, respectively. The Kansas City metro area grew 0.5%, but faster in Missouri (0.6%) — which accounts for 59% of the MSA’s total population — than in Kansas (0.4%).
The population of the St. Louis metro area (2.8 million) changed little between 2019 and 2020, but there were divergent trends within the metro area. The Illinois counties of the St. Louis metro area — which account for roughly 25% of the total population — lost population. The Missouri counties grew 0.2%, and as will be discussed in greater detail below, much of this growth occurred in St. Charles County, which added more net new residents (4,579) than any other Missouri county. By contrast, St. Louis City and St. Louis County lost an estimated 4,700 residents combined between 2019 and 2020.
Two Missouri metros lost population between 2019 and 2020. The Jefferson City metro area lost 0.5% of its population (775 people) and now has just over 150,000 residents; 75% of those net losses were in Cole County. Similarly, the St. Joseph, MO-KS metro has approximately 122,500 people after losing 0.6% of its population (741 people) between 2019 and 2020. Most of those losses occurred in Buchanan County, the region’s largest county.
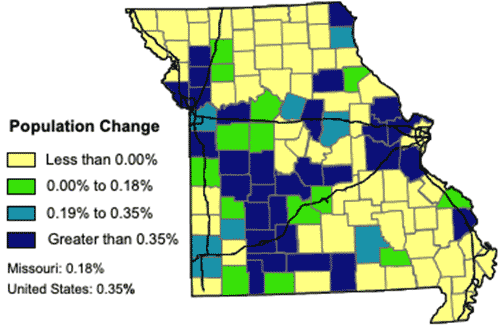 Figure 3. Annual population change in Missouri counties (2019–2020). (Source: U.S. Census Bureau)
Figure 3 shows the percent population change for all Missouri counties between 2019 and 2020. The primary areas of growth occurred in suburban St. Louis, the Kansas City metro area, most of the I-70 corridor, the area around the Lakes, and the US 65 Corridor, among others. In addition to the losses occurring in the Jefferson City and St. Joseph metro areas, many nonmetro counties in Northern and Southeastern Missouri also lost population. Overall, 62 of Missouri 115 counties (including St. Louis City) lost population between 2019 and 2020. During that period, 10 of Missouri’s 35 metro counties and 52 of its 80 nonmetro counties lost population.
Over the past decade, Missouri’s metro and nonmetro areas have not kept pace
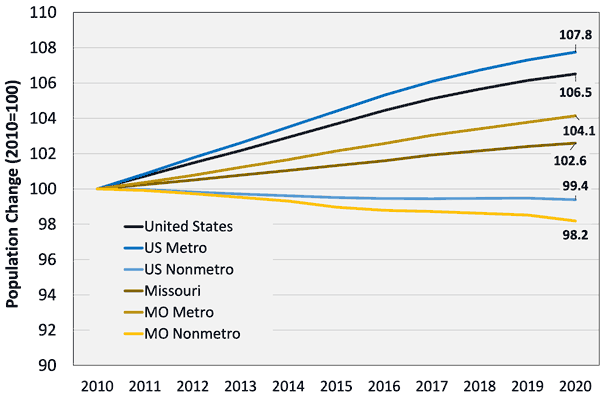
Figure 4. Index of population change in metro and nonmetro counties. (Source: U.S. Census Bureau, Population Estimates Program, V2020; 2020 MSA Definitions)
The trends described above offer a snapshot of the state’s population trends, but most demographic trends are better understood over longer time periods. Figure 4 shows the population trends in metro and nonmetro counties in Missouri and nationally. In both the state and nation, metro areas drive overall growth. Nationwide, metro counties grew 7.8% since 2010 as compared to the nation’s overall growth of 6.5%. During this same period, Missouri’s metro counties grew 4.1% while the state grew 2.6% overall. Conversely, nonmetro counties have lost population since 2010 and that decline has been greater in Missouri (-1.8%) than nationally (-0.6%).
Shrinking populations in nonmetro counties lead to fewer workers and consumers, and a diminished tax base. This presents real challenges for those rural communities and businesses. However, sluggish growth in Missouri’s metro areas creates challenges for the state as a whole. The state’s metro areas are its economic engines. For instance, the Missouri counties in the St. Louis metro area represent almost 35% of the state’s population and accounts for almost 44% of the state’s total Gross Domestic Product (GDP).4 Combined, the Missouri counties of the St. Louis and Kansas City metro areas represent almost two-thirds of the state’s economic activity. If those regions see slowing population growth, then it will prove difficult for the state to keep up, let alone get ahead.
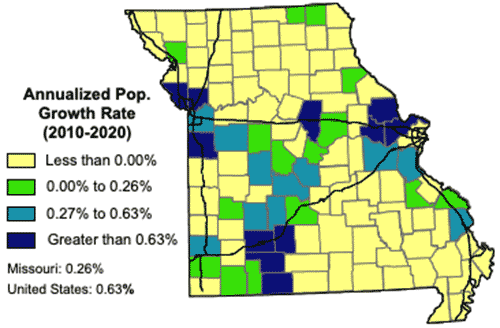 Figure 5. Annualized growth rates in Missouri counties (2010–2020). (Source: U.S. Census Bureau)
Figure 5 shows the compound annualized growth rates for Missouri counties since 2010. Only 11 of the Missouri’s 115 county-equivalents grew faster than the nation’s annualized growth rate. These faster growing counties are located in suburban Kansas City (Cass, Clay, Platte), suburban St. Louis (St. Charles, Lincoln, Warren), Columbia (Boone), and Springfield (Greene, Webster, Christian, Taney). Areas that grew faster than the state average but slower than the national average were found in parts of the Kansas City metro, the southern suburbs of St. Louis, the Joplin and Cape Girardeau areas, and around the Lakes.
In total, 78 of Missouri’s 115 counties (68%) had fewer residents in 2020 than they had in 2010; 64 of those counties were in nonmetro areas.5 In some cases, these losses were substantial. For instance, St. Louis City (-21,700) and St. Louis County (-4,800) lost a combined 26,500 residents — 2% of their total population — over the past decade. In other areas, like the Missouri Bootheel, the relative scale of the losses are much more significant. For instance, Pemiscot County has lost almost 15% of its 2010 population over the past decade, while New Madrid County (-12%), Mississippi County (-11%), and Dunklin (-10%) have also lost significant population since 2010. Similar losses have occurred in parts of Northwest Missouri.
Migration and natural change dictate regional population growth trajectories
These aggregate trends only tell part of the story, as several underlying factors can further explain population growth or decline. At the most basic level, two primary factors — migration and natural change — dictate the trajectory of an area’s population.
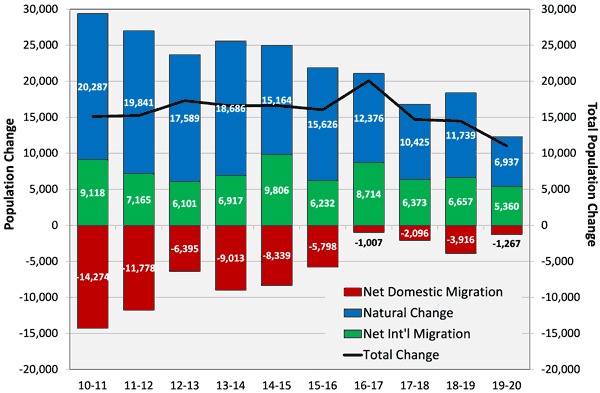
Figure 6. Components of population change in Missouri (2010–2020). (Source: U.S. Census Bureau, Population Estimates Program, V2020)
- Migration (domestic and international): Positive net migration (i.e., more people moving-in than moving-out) shows that places can attract new residents by creating attractive employment opportunities and/or offering an appealing quality of life. Net out-migration may result from an insufficient number of high-quality job opportunities to attract new residents and/or retain existing workers and residents.
- Natural Change (births minus deaths): An area’s age profile often determines natural change. For instance, places with a relatively greater share of people in their prime child-bearing years will likely experience greater natural increase than places with relatively older populations. Places with negative natural change often have relatively older populations. Other factors that may influence natural change include life expectancy and access to healthcare, amenities for retirees, and region cost of living, among other factors.
The U.S. Census Bureau’s annual population estimates show the components of population change at the state and county level. Figure 6 illustrates how natural change and migration shaped the trajectory of Missouri’s population since 2010. Overall, the state’s 11,000 net new residents in 2020 marked the smallest single year increase in the past ten years. This is due in part to several factors, including a slowing rate of natural change. At the beginning of the decade, Missouri averaged 18,000 to 20,000 more births than deaths, while the state averaged only 10,000 to 12,000 more births than deaths over the second half of the decade.6
This diminished rate of natural increase has been offset, in part, by positive gains from migration — principally, immigration. Since 2014, Missouri has added more residents through migration than it has lost. These gains, however, are due to a steady influx of international in-migrants. By contrast, Missouri continues to experience net domestic out-migration even though the scale of domestic out-migration has declined significantly in recent years.7 In addition, the diminished rate of natural increase has slowed the state’s overall population growth.
Growth occurs unevenly between and within Missouri’s regions
Population growth occurs unevenly, so it is important to recognize how these trends shape different communities throughout the state. In order to understand these differences, this section looks at regional population trends and the components of population change. We used Missouri’s workforce development board regions as they generally represent the state’s economic regions.8 The Missouri Economic Research and Information Center (MERIC) uses the same regions to publish employment data.
Central Region
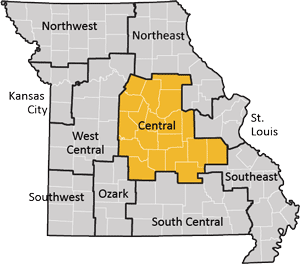
The 20 counties of the Central region (Figure 7) are home to almost 12% of Missouri’s population, a share that remained constant between 2010 and 2020. As with the state as a whole, the region’s annual growth slowed over the course of the decade due to slower natural change and international in-migration. Within the region, there are divergent trends between the Columbia and Jefferson City metro areas, counties near the Lake of the Ozarks, and the region’s more rural counties.
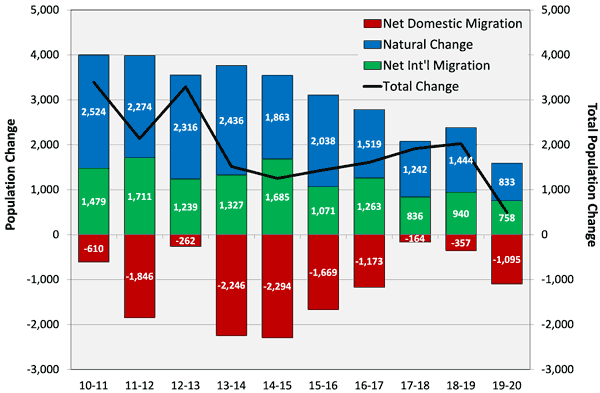
Figure 7. Components of population change in the Central Missouri region (2010–2020). (Source: U.S. Census Bureau, Population Estimates Program, V2020; 2020 MSA Definitions)
- Boone County (Columbia, MO) accounts for 25% of the region’s total population (183,000 people). The county’s population grew 12% over the past decade, which accounted for the majority of the region’s total population growth. During this period, Boone County’s annualized growth rate (1.2%) was the 7th fastest in Missouri. The county’s growth was driven by a combination of natural increase and net in-migration. The University of Missouri attracts in-migrants and over the past decade net international migration contributed more to the county’s overall population growth than domestic migration.
- In the Lake of the Ozarks region, Camden and Miller counties have also experienced growth, primarily through net domestic in-migration. Camden County added over 3,000 net new in-migrants between 2010 and 2020, but lost over 900 net residents through negative natural change. Natural amenities (e.g., lakes, mountains) draw retirees, but these new residents do not necessarily expand the region’s workforce or student population.
- Jefferson City MSA counties (Cole, Moniteau and Osage) and some counties along the I-44 corridor (Crawford, Phelps, and Pulaski) experienced slow or negative growth over the past decade. Gains through natural change were largely offset by net domestic out-migration.
Kansas City Region
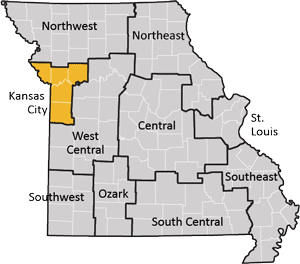
Over the past decade, the Kansas City region reversed a key demographic trend by attracting more domestic migrants than it lost (Figure 8). This in-migration was particularly strong during the middle part of the decade, and further offset slowing rates of natural change. Overall, the region’s five counties9 account for over 19% (1.2 million) of the state’s total population, after adding 85,000 net new residents between 2010 and 2020.
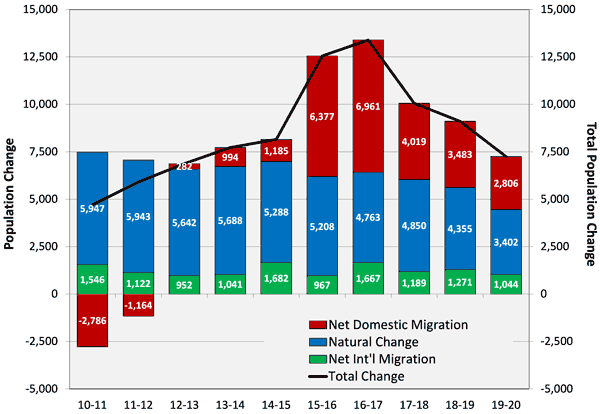
Figure 8. Components of population change in the Kansas City region (2010–2020). (Source: U.S. Census Bureau, Population Estimates Program, V2020; 2020 MSA Definitions)
- With almost 706,000 residents, Jackson County accounts for 59% of the region’s total population and over 11% of the state’s total population. Since 2017, Jackson County has experienced net domestic out-migration, but grew overall. Over the past decade, Jackson County added over 31,000 net new residents.
- Platte and Clay counties had Missouri’s first and fourth fastest annual growth rates, respectively, between 2010 and 2020. Combined, these two counties added approximately 48,000 net new residents through both natural change and in-migration over the past decade.
- Cass County had the state’s 11th fastest annual growth rate between 2010 and 2020. Much of this growth occurred during the latter part of the decade, driven in large part by net domestic in-migration caused by Kansas City’s expanding suburbs.
- Ray County is the region’s smallest county with just under 23,000 residents. Unlike the other counties in the Kansas City region it lost 2.6% of its population (-600 net residents) between 2010 and 2020, largely through net domestic out-migration.
Northeast Region
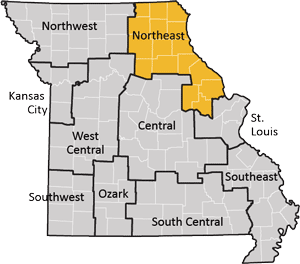
Throughout most of Northeast Missouri, regional population trends resemble those found in other rural parts of Northern Missouri. As a result, most of the region’s largely rural counties lost population due to net domestic out-migration (Figure 9). Starting in 2016, the region’s overall population grew, primarily from the St. Louis suburbs expanding into Lincoln and Warren counties.10
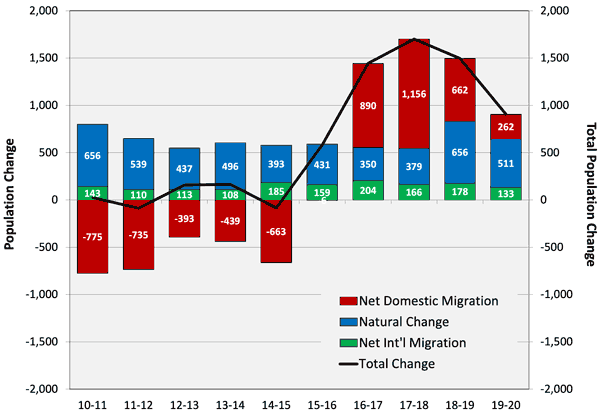
Figure 9. Components of population change in the Northeast Missouri region (2010–2020). (Source: U.S. Census Bureau, Population Estimates Program, V2020)
- Lincoln and Warren counties had Missouri’s third and sixth fastest annualized growth rates, respectively, between 2010 and 2020. During this period Lincoln County’s population grew by 14% and now has over 60,000 residents. Warren County grew by 12% and now has over 36,000 residents.
- The only other Northeast region counties to grow between 2010 and 2020 were Ralls (+103), Schuyler (+93), and Scotland (+30) counties, and those marginal gains resulted primarily from positive natural change.
- Counties with some of the region’s prominent smaller cities like Hannibal (Marion), Kirksville (Adair), and Moberly (Randolph), lost population due largely to net domestic out-migration.
- Montgomery and Shelby counties experienced the region’s largest relative percent declines, as they lost 7.5% and 7.0% of their population, respectively, between 2010 and 2020.
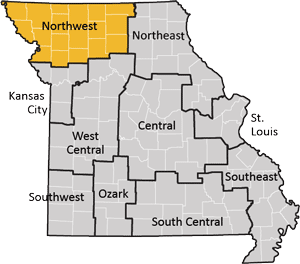
Northwest Region
There are just over 250,000 people in the 18-county Northwest region, which is down almost 5% (-12,500) from its 2010 population. As in many rural areas (both in Missouri and elsewhere), net domestic out-migration combined with minimal natural increase due to the region’s aging population accounts for most of the region’s declining population (Figure 10).
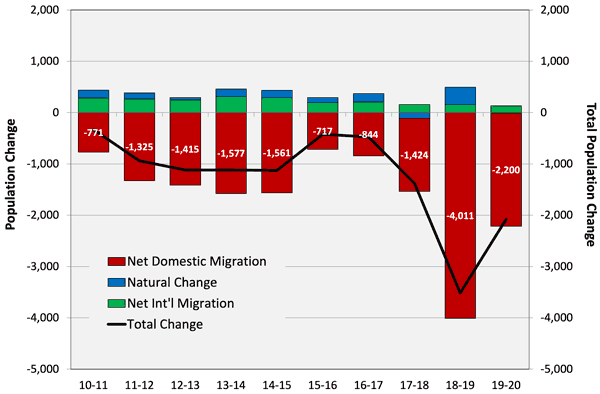
Figure 10. Components of population change in the Northwest Missouri region (2010–2020). (Source: U.S. Census Bureau, Population Estimates Program, V2020)
- Buchanan County (St. Joseph, MO) accounts for 35% of the region’s population, but the county lost almost 3% of its population between 2010 and 2020. These losses resulted from net domestic out-migration, as during this period 6,100 more people moved out of the county to other domestic locations than moved into the county from other U.S. locations.
- Nodaway County (Maryville, MO) also experienced population loss between 2010 and 2020. Although the county experienced marginal gains through natural change and international migration, a net 2,100 domestic movers left the county. Overall the county’s population declined by 7% during this period.
- Several other more rural counties experienced significant, relative population declines over the past decade. DeKalb County lost 15% of its population — the greatest relative loss of any Missouri County; some of these losses are attributable the closure of the Crossroads’ Correctional Center in Cameron, MO. Other counties that lost significant shares of their population between 2010 and 2020 include Holt (-14%), Sullivan (-10%) and Atchison (-10%).
- Andrew County was the only county in Northwest Missouri to grow its population between 2010 and 2020, adding 240 people during this time period. This growth was the result of positive natural change.
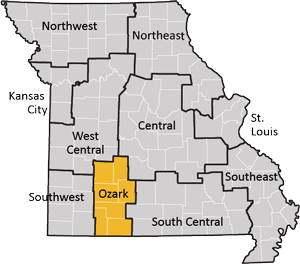
Ozark Region
The Ozark region represent one of the state’s consistent growth regions (Figure 11). The 7-county region currently represents 9% of Missouri’s total population and it grew 8.1% (+42,300) between 2010 and 2020. Moreover, every county in the region experienced positive population growth during this period due to natural increase and net in-migration.
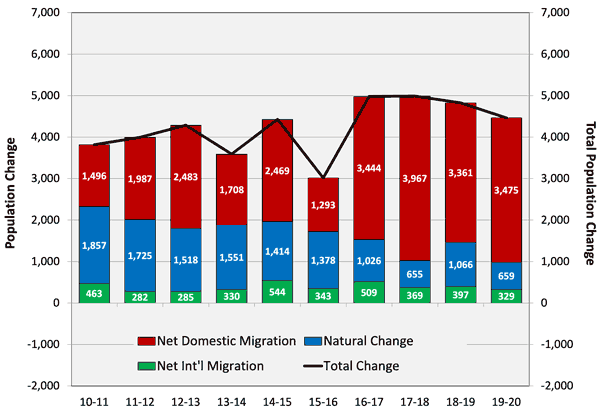
Figure 11. Components of population change in the Ozark region (2010–2020). (Source: U.S. Census Bureau, Population Estimates Program, V2020)
- With 295,000 people, Greene County (Springfield, MO) is the state’s 5th largest county-equivalent behind St. Louis, Jackson, and St. Charles counties and St. Louis City. The county added almost 20,000 net new residents over the past decade, an increase of 7%. If current growth trends continue, it will soon have a larger population than St. Louis City (297,600).
- Springfield’s suburban counties also experienced above average growth. Due to growth in places like Nixa and Ozark, Christian County had the state’s second fastest annualized growth rate (1.5%) between 2010 and 2020. During this time, the county added almost 13,000 net new resident — an increase of 16.5% over its 2010 population. Webster County had Missouri’s 8th fastest annualized growth rate (0.9%) over the past decade, and grew its population by almost 10%.
- In the Branson area, both Taney and Stone counties grew over the past decade. Through both natural increase and migration, Taney County grew 8.1% between 2010 and 2020 and its annualized growth rate was Missouri’s 8th fastest. Likely more than many places, Taney County’s population was affected by the pandemic as there was very little change in its population between 2019 and 2020. Net domestic in-migration caused Stone County to grow over the past decade, in spite of negative natural change. While in-migration from retirees has increased the area’s population, there has not been corresponding growth in the area labor force.
South Central Region
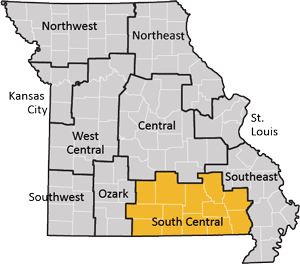
With just over 205,000 residents, the South Central region is Missouri’s least populated. Each of the region’s 12 counties lost population between 2010 and 2020, due to a combination of net domestic out-migration and negative natural change brought about by an aging population (Figure 12). Over the past decade, the region lost 3% of its population, or just over 6,000 people.
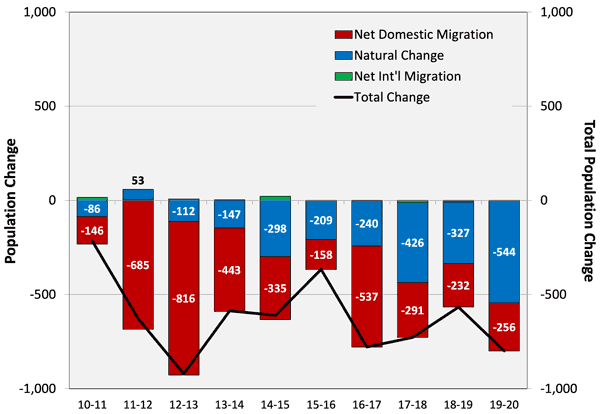
Figure 12. Components of population change in the South Central Missouri region (2010–2020). (Source: U.S. Census Bureau, Population Estimates Program, V2020)
- The region’s two largest counties include Butler County (Poplar Bluff, MO) and Howell County (West Plains, MO) which both have just over 40,000 residents. Between 2010 and 2020, Butler and Howell counties lost 1.4% (-607 people) and 0.7% (-282 people) of their population, respectively.
- Over the past decade, the most relative losses occurred in Reynolds (-7.2%), Ozark (-6.8%), Ripley (-5.7%), and Wayne (-5.5%) counties.
- The greatest net losses occurred in Texas (-931), Ripley (-802), and Wayne (-750) counties.
- Population growth did occur between 2019 and 2020 in Douglas (0.7%), Howell (0.4%), Shannon (0.3%), and Carter (0.2%) counties.
Southeast Region
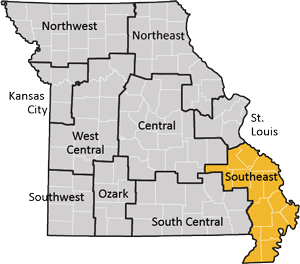
As a region, Southeastern Missouri lost 7,800 residents (-2.1%) between 2010 and 2020. This aggregate population loss resulted from net domestic out-migration, and especially over the second half of the last decade, negative natural change (Figure 13). These trends, however, were not consistent throughout the region. Most population loss occurred in Missouri’s Bootheel, whereas several counties in the northern part of the region (e.g., Cape Girardeau, St. Francois, Perry) grew between 2010 and 2020.
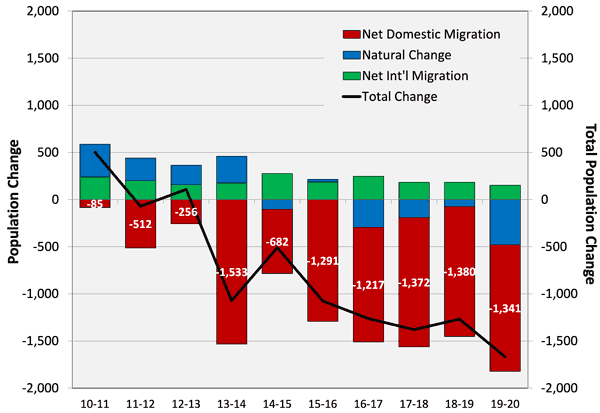
Figure 13. Components of population change in the Southeast Missouri region (2010–2020). (Source: U.S. Census Bureau, Population Estimates Program, V2020)
- The region’s largest county, Cape Girardeau, added an estimated 3,600 net new residents between 2010 and 2020 and its population is now almost 80,000. During this time period it had an annualized growth rate of 0.5%, making it Missouri’s 13th fastest growing county. This growth resulted from international in-migration, natural increase, and domestic in-migration.
- St. Francois County is the region’s second largest county (66,500). It added 950 net new residents over the past decade at a rate of 0.1% annually, in large part due to net domestic in-migration offsetting negative natural change.
- As noted above, the most significant losses occurred in the Bootheel area. Between 2010 and 2020, Pemiscot (-1.6%), New Madrid (-1.2%), Mississippi (-1.2%), and Dunklin (-1.0%) counties had the state’s second, fourth, fifth, and eighth fastest annual rates of decline. Combined these counties lost an estimated 9,600 residents during this period. These losses resulted for net domestic out-migration and, with the exception of Pemiscot County, negative natural change.
Southwest Region
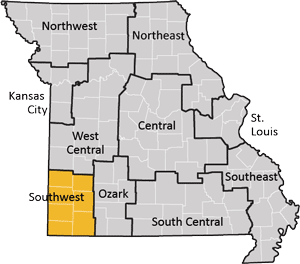
In 2020, Missouri’s Southwest region had an estimated 296,000 people and, for most of the past decade, this region has experienced relatively steady population growth (Figure 14). The 2011 Joplin tornado created significant disruption and displaced large numbers of people from Jasper County. Since 2013, however, the region has generally added anywhere from 500 to 1,000 people per year. This growth has occurred within the Joplin MSA (Jasper and Newton counties). By contrast, four of the region’s five nonmetro counties lost population over the past decade.
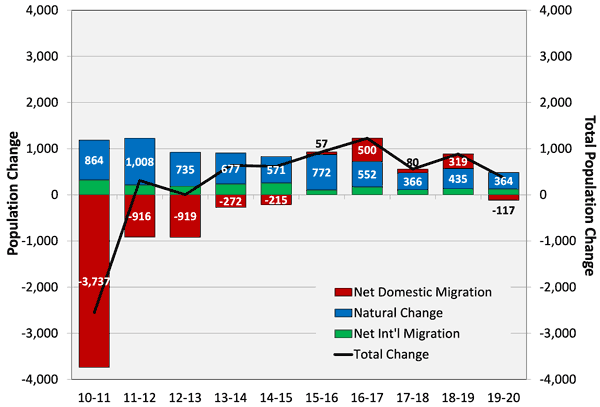
Figure 14. Components of population change in the Southwest Missouri region (2010–2020). (Source: U.S. Census Bureau, Population Estimates Program, V2020)
- With an estimated 121,650 people, Jasper County (Joplin, MO) is the region’s largest county. Between 2010 and 2020, the county added over 4,000 net new residents and grew at a rate of 0.3% annually, in large part through natural increase and international migration.
- Newton and Barry counties were the other two jurisdictions to experience marginal population growth between 2010 and 2020, growing 0.5% and 0.7% respectively.
- McDonald County lost a net of 1,600 residents to domestic out-migration, but these losses were somewhat offset by positive natural change and international in-migration.
- As with many other nonmetro counties, Barton and Lawrence counties experienced relatively significant net domestic out-migration.
St. Louis Region
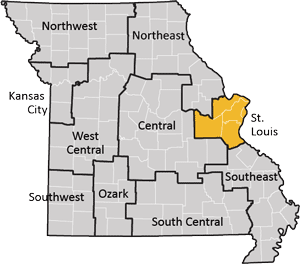
With over 2 million residents, the 5 jurisdictions in the St. Louis workforce region11 account for a third of the state’s total population. However, the region’s suburban counties and its core jurisdictions of St. Louis City and St. Louis County have diverging growth trajectories. The population gains found in counties such as St. Charles or Jefferson counties often occur at the expense of St. Louis City and St. Louis County. That said, the region as a whole experienced minimal growth over the past decade, and even experienced population decline between 2015 and 2018 (Figure 15). During this period, net domestic out-migration — a chronic regional challenge — was at its greatest. A review of IRS migration data show that during this period, the St. Louis MSA on net lost residents to faster growing metros like Dallas and Denver and retirement destinations like Tampa and Phoenix.12 The declining rate of natural increase, particularly during the second half of the decade, represents another long-term challenge for the St. Louis region (and the state as a whole).
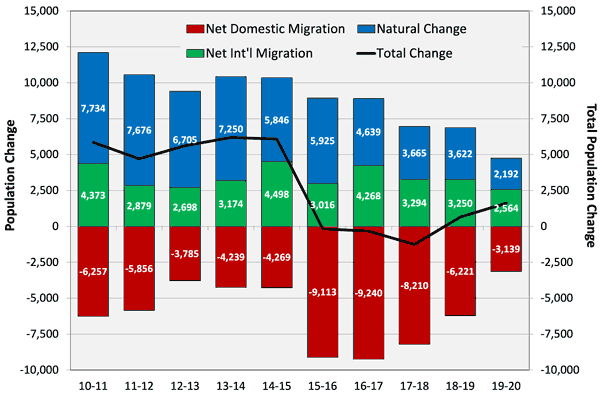
Figure 15. Components of population change in the St.Louis region (2010–2020). (Source: U.S. Census Bureau, Population Estimates Program, V2020)
- In 2020, St. Louis County and St. Louis City were Missouri’s first and fourth largest jurisdictions. St. Louis County has experienced net population losses each of the past five years, St. Louis City has lost population each of the last eight years. Combined the two jurisdictions lost over 26,500 residents between 2010 and 2020, as well as 45,000 residents between 2000 and 2010.
- St. Charles County is currently Missouri’s third largest county (406,000 residents) and it gained more net new residents — over 44,000 people since 2010 — than any other county in the state. This represents a 12.3% increase over the past decade and, with an annualized growth rate of 1.2%, was Missouri’s 5th fastest growing county during that time period.
- Combined, Franklin and Jefferson counties added almost 10,500 net new residents between 2010 and 2020. These counties grew slower than other suburban St. Louis counties, but with annual growth rates of 0.3% Franklin and Jefferson counties were the state’s 18th and 19th fastest growing counties over the past decade.
West Central Region
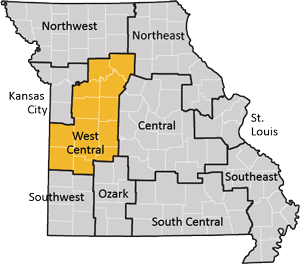
Throughout the first part of the past decade the West Central region mirrored many other nonmetro areas. The region had minimal natural increase and experienced substantial net domestic out-migration (Figure 16). These trends began to reverse during the second half of the decade. Even though the region lost over 1,800 residents since 2010, it has nevertheless experienced positive population growth every year since 2016.
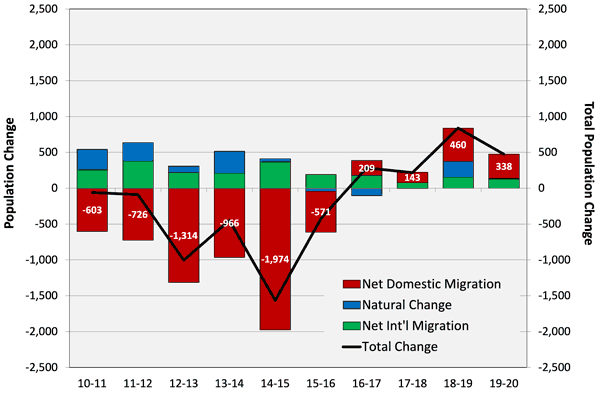
Figure 16. Components of population change in the West Central Missouri region (2010–2020). (Source: U.S. Census Bureau, Population Estimates Program, V2020)
- Johnson County (Warrensburg, MO) is home to 54,200 residents and is the region’s largest county. Between 2010 and 2020, the county added over 1,500 net new residents due to strong rates of natural increase and international in-migration.
- Pettis County (Sedalia, MO) is the region’s second largest county (42,500). It experienced more modest growth (0.5%) between 2010 and 2020, as positive natural growth and international in-migration offset net domestic out-migration.
- Benton County (Warsaw, MO) added almost 520 net new residents between 2010 and 2020, an increase of 2.7%, and it now has almost 20,000 residents. The Truman Lake area attracts retirees and second home buyers, and this net domestic in-migration can offset losses through negative natural change. Similar trends, particularly in the second half of the decade, occurred in Henry (Clinton, MO) and St. Clair (Osceola, MO) counties. In these instances, counties are adding residents but not necessarily growing their workforce.
- More rural parts of the West Central region, such as Bates, Carroll and Chariton counties have demographic trends more consistent with the state’s other nonmetro counties. As a result, their population losses over the past decade resulted from a combination of negative natural change and net domestic out-migration.
The trends shaping Missouri’s regions are consistent with many national trends
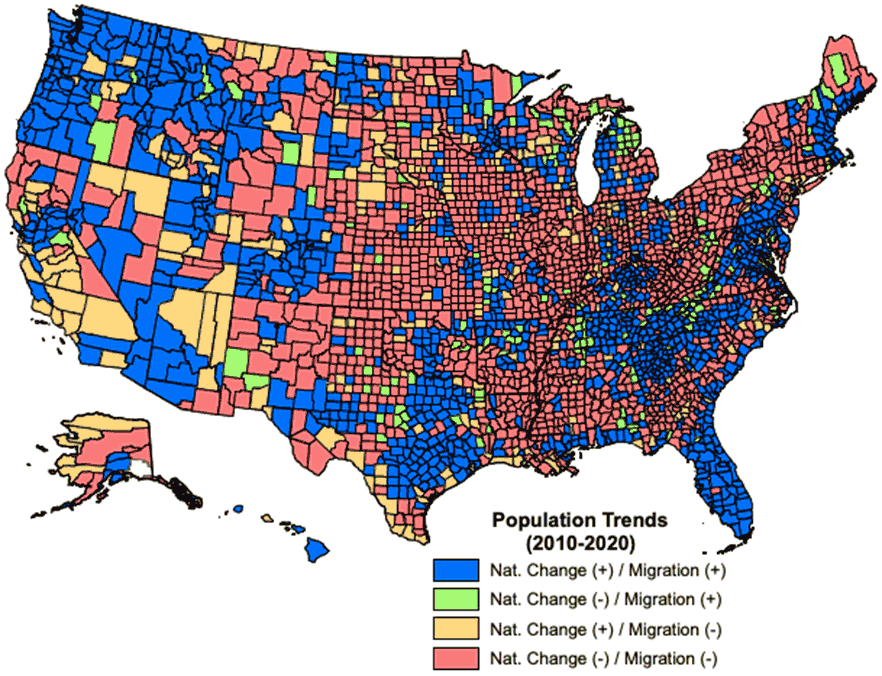
Figure 17. Components of population trends in U.S. Counties (2010–2020). (Source: U.S. Census Bureau)
Missouri’s diverse regions lead to different demographic trajectories around the state. However, Missouri is not unique and similar trends are found in regions throughout both the Midwest and the United States. In order to place these trends in geographic context, Figure 17 highlights the dominant demographic changes (e.g., natural increase or decrease, net in-migration or net-out-migration) for all counties over the past decade.
Regions experiencing both natural increase and net in-migration include growing metro areas and the adjacent areas affected by the suburbanization process. In more rural areas, these growth areas often possess some kind of natural amenity (e.g., lakes, mountains, etc.) that makes them attractive to mobile residents or retirees. Declining regions — those that experience both natural decrease and net-outmigration — are found throughout the Northeast, Midwest, Great Plains and parts of the Intermountain West. These areas include older industrial cities or are often rural regions and/or areas of chronic poverty (e.g., Central Appalachia, Mississippi Delta).
In both these instances, there are virtuous and vicious cycles that establish these demographic trajectories. However, there are areas where these trends are not as clear cut. For instance, places with net in-migration but natural decline may represent emerging retirement or recreational areas (e.g., the area around Truman Lake in Missouri, the North Carolina Foothills, or Northern Wisconsin). Depending on the scale of growth, these regions — particularly those with a large retirement communities — may be growing their population but not their labor force. In such instances, these regions may be tilting toward becoming growth counties but will need to attract and retain more people of prime working age to perpetuate that growth.
Unlike retirement destinations, higher education institutions can attract younger, often international, in-migrants. Outside of Missouri’s larger metro counties international migration made significant positive contributions to population growth in several counties that are home to 4-year institutions, including Boone (University of Missouri), Greene (Missouri State University), Phelps (Missouri S&T), Cape Girardeau (Southeast Missouri State University), and Adair (Truman State University) counties. Other counties where international in-migration makes a relatively significant contrition to the county’s overall population growth were places with a relatively large meat processing industry, such as Buchanan, McDonald and Sullivan counties. In both these instances, international migration can partially offset the losses that may occur through natural decrease or net domestic out-migration. The challenge facing these places is to trying to find ways connect students or immigrants to the community so they may become more long-term residents and contribute to a more virtuous cycle of population growth.
By contrast several underlying factors may cause some places to grow through natural increase, but still experience net out-migration. For instance, in some of the country’s more urbanized regions (e.g., New York City, Philadelphia, the inner suburbs of Washington D.C., and parts of the San Francisco Bay area), the high cost of living and lack of affordable and appropriate housing makes it prohibitive for younger families to live there. In these instances, smaller less expensive metros or more distant suburban areas may prove more attractive to younger families. These counties are sufficiently large to maintain positive natural change, but this may not last forever as the existing population ages in place. In more rural counties, populations with high fertility rates may partially offset net out-migration. However, the out-migration stemming from a relative lack of economic opportunities may lead to overall population decline. Consequently, these places must give people a reason to stay or they will risk losing the population gains made through natural increase.
Concluding thoughts
Over the past year and past decade, Missouri’s population growth has been about half the national average. Missouri is a relatively slow growth state, but its growth trajectory is largely consistent with its neighbors and other Midwestern states. Nevertheless, this growth is uneven throughout the state. For instance, only 11 Missouri counties grew faster than the nation between 2010 and 2020, but 78 Missouri counties (including St. Louis City) had fewer residents in 2020 than they had in 2010. Shrinking populations present real challenges for nonmetro counties, as they reduce the number of available workers, consumers, and potential tax revenues. This also applies to metro counties, but since metro areas drive the overall state economy, below average growth in these areas presents a challenge for the entire state. Combined, the Missouri counties of the St. Louis and Kansas City metro areas account for roughly 55%of the state’s population and almost two-thirds of its economy. If those regions cannot keep pace, the state cannot keep pace with the rest of the United States.
These population trends impact regions differently. Growth regions must maintain their capacity to attract and retain people of all ages. Regions that attract people, but have an older populations must find ways to attract and retain working age people to strengthen their local workforce. Many factors can attract new residents. For instance, one recent study noted the importance of critical infrastructure (e.g., broadband) and housing availability and quality as key factors for attracting new in-migrants.13 Areas with chronic out-migration must also address why people leave in the first place. A 2015 study by the USDA Economic Research Service (ERS) found family motivates former residents to return, but they still require adequate job opportunities to make that decision.14 Moreover, former residents also found other factors — shorter commutes, lower cost of living, outdoor amenities and a community feel — appealing. Among the factors discouraging people to return included financial and career sacrifices, too much familiarity, lack of cultural amenities, or school quality.
These population trends reveal a lot about a place’s growth trajectory and the challenges and opportunities that they may face. However, they only tell part of the story and more information is required to more fully understand these trends and what they mean for the region’s workforce. In June 2021, the U.S. Census Bureau’s Population Estimates Program will release additional 2020 data about age, gender, and race and ethnicity for all U.S. counties. A subsequent report will utilize those data to help better understand some of the changing demographics in Missouri’s workforce, particularly some of the challenges posed by an aging population.
- Although the estimates are not a head count like the Decennial Census, they are produced annually they allow us to see intercensal trends and the components of population change. They use the Decennial Census as benchmark, so the 2010 and 2020 estimates are very close to the Census population counts.
- With each annual release, the Population Estimates Program revises and updates the entire time series back to the previous Decennial Census.
- Based on the U.S. Office of Management and Budget (OMB)’s 2020 definitions of Metropolitan Statistical Areas.
- Gross Domestic Product Trends. (2021, January). Missouri Economy Indicators, 2(1). (PDF)
- In many instances, population loss has been a much longer-term trend. For instance, 52 of Missouri’s 115 counties (including St. Louis City) had fewer people in 2020 than they had in 2000; of those 52 counties, 46 were nonmetro counties. With the exception of St. Louis City and County, the metro counties with smaller populations than they had in 2000 were relatively smaller counties in large metro areas, including Bates and Ray counties in the Kansas City metro, DeKalb in the St. Joseph metro, and Howard in the Columbia metro.
- The 2019-2020 estimates include the first several months of the pandemic. The pandemic likely increased deaths and reduced mobility, but the full impact of the pandemic on these population trends is not yet fully understood.
- This trend is consistent with the finding of surveys such as United Van Lines National Movers Study which shows that more people are leaving the state than moving into Missouri. Jobs and family are the primary motivations for people moving into Missouri, whereas jobs, retirement and family were the primary reason for people leaving the state.
- MERIC consolidates the two Kansas City and four St. Louis area workforce boards to better describe labor market commuting areas. County data, including their regional designation, are available in the Appendix.
- There are a total of 9 Missouri Counties in Kansas City, MO-KS Metropolitan Statistical Area (MSA). Bates, Caldwell, Clinton, and Lafayette counties are part of the MSA, but not part of the 5 county Kansas City workforce region.
- Lincoln and Warren counties are included in the St. Louis, MO-IL Metropolitan Statistical Area (MSA).
- Whereas most other regions cover the service area or a single workforce board region, the St. Louis region combines 4 different workforce boards including the workforce boards of St. Louis City, St. Louis County, St. Charles County, and the Jefferson-Franklin Workforce Development Board. It should also be noted that based on the U.S. Office of Management and Budget’s 2020 MSA definitions, the broader St. Louis, MO-IL MSA also includes 8 counties in Illinois and Lincoln and Warren counties in Missouri.
- Migration Patterns. (2021, February). Missouri Economy Indicators, 2(4). (PDF)
- Stoker, P., Rumore, D., Romaniello, L. and Levine, Z. (2020) ‘Planning and Development Challenges in Western Gateway Cities,’ Journal of the American Planning Association. 87(1): 21-33.
- Cromartie, J., von Reichert, C. and Arthun, R. (2015). Factors Affecting Former Residents’ Returning to Rural Communities. USDA Economic Research Service, Economic Research Report No. 185. This study drew upon interviews conducted at high school reunions in order to gather information from people who stayed, left and returned, or never returned.
Appendix: Population trends in Missouri counties
| Region | MSA | County | 2010 Pop. | 2019 Pop. | 2020 Pop. | Change 19-20 | % Change 19-20 | Change 10-20 | % Change 10-20 | Annual Growth Rate 10-20 | Natural Increase 10-20 | Net Int'l Migration 10-20 | Net Domestic Migration 10-20 |
|---|---|---|---|---|---|---|---|---|---|---|---|---|---|
| State | Missouri | 5,996,089 | 6,140,475 | 6,151,548 | 11,073 | 0.2% | 155,459 | 2.6% | 0.3% | 148,670 | 72,443 | -63,883 | |
| Northeast | Nonmetro | Adair | 25,638 | 25,511 | 25,399 | -112 | -0.4% | -239 | -0.9% | -0.1% | 444 | 1,008 | -1,697 |
| Northwest | St. Joseph, MO-KS MSA | Andrew | 17,345 | 17,699 | 17,586 | -113 | -0.6% | 241 | 1.4% | 0.1% | 236 | -16 | 32 |
| Northwest | Nonmetro | Atchison | 5,656 | 5,109 | 5,096 | -13 | -0.3% | -560 | -9.9% | -1.0% | -262 | 15 | -318 |
| Central | Nonmetro | Audrain | 25,453 | 24,962 | 24,835 | -127 | -0.5% | -618 | -2.4% | -0.2% | 364 | 27 | -999 |
| Southwest | Nonmetro | Barry | 35,555 | 35,789 | 35,818 | 29 | 0.1% | 263 | 0.7% | 0.1% | -10 | 136 | 161 |
| Southwest | Nonmetro | Barton | 12,384 | 11,681 | 11,592 | -89 | -0.8% | -792 | -6.4% | -0.7% | -42 | 11 | -768 |
| West Central | Kansas City, MO-KS MSA | Bates | 17,026 | 16,213 | 16,242 | 29 | 0.2% | -784 | -4.6% | -0.5% | -234 | 18 | -577 |
| West Central | Nonmetro | Benton | 19,109 | 19,477 | 19,627 | 150 | 0.8% | 518 | 2.7% | 0.3% | -1,367 | 0 | 1,891 |
| Southeast | Cape Girardeau- Jackson, MO- IL MSA | Bollinger | 12,349 | 12,142 | 12,111 | -31 | -0.3% | -238 | -1.9% | -0.2% | -24 | 4 | -214 |
| Central | Columbia, MO MSA | Boone | 163,208 | 181,084 | 182,991 | 1,907 | 1.1% | 19,783 | 12.1% | 1.2% | 10,231 | 6,410 | 3,137 |
| Northwest | St. Joseph, MO-KS MSA | Buchanan | 89,071 | 87,212 | 86,530 | -682 | -0.8% | -2,541 | -2.9% | -0.3% | 1,865 | 1,728 | -6,109 |
| South Central | Nonmetro | Butler | 42,785 | 42,574 | 42,178 | -396 | -0.9% | -607 | -1.4% | -0.1% | -258 | 27 | -337 |
| Northwest | Kansas City, MO-KS MSA | Caldwell | 9,428 | 9,039 | 9,051 | 12 | 0.1% | -377 | -4.0% | -0.4% | -91 | 12 | -306 |
| Central | Jefferson City, MO MSA | Callaway | 44,312 | 44,762 | 44,887 | 125 | 0.3% | 575 | 1.3% | 0.1% | 1,079 | 233 | -716 |
| Central | Nonmetro | Camden | 44,096 | 46,211 | 46,414 | 203 | 0.4% | 2,318 | 5.3% | 0.5% | -924 | 127 | 3,099 |
| Southeast | Cape Girardeau- Jackson, MO- IL MSA | Cape Girardeau | 75,905 | 78,971 | 79,512 | 541 | 0.7% | 3,607 | 4.8% | 0.5% | 1,265 | 1,396 | 994 |
| West Central | Nonmetro | Carroll | 9,282 | 8,698 | 8,554 | -144 | -1.7% | -728 | -7.8% | -0.8% | -183 | 32 | -578 |
| South Central | Nonmetro | Carter | 6,292 | 5,981 | 5,991 | 10 | 0.2% | -301 | -4.8% | -0.5% | -26 | -2 | -270 |
| Kansas City | Kansas City, MO-KS MSA | Cass | 99,756 | 105,731 | 106,806 | 1,075 | 1.0% | 7,050 | 7.1% | 0.7% | 2,329 | 196 | 4,595 |
| Central | Nonmetro | Cedar | 13,969 | 14,301 | 14,322 | 21 | 0.1% | 353 | 2.5% | 0.2% | -259 | 5 | 615 |
| West Central | Nonmetro | Chariton | 7,836 | 7,463 | 7,360 | -103 | -1.4% | -476 | -6.1% | -0.6% | -86 | 7 | -397 |
| Ozark | Springfield, MO MSA | Christian | 77,841 | 88,913 | 90,655 | 1,742 | 2.0% | 12,814 | 16.5% | 1.5% | 3,951 | 344 | 8,525 |
| Northeast | Nonmetro | Clark | 7,139 | 6,804 | 6,830 | 26 | 0.4% | -309 | -4.3% | -0.4% | -56 | 30 | -285 |
| Kansas City | Kansas City, MO-KS MSA | Clay | 222,649 | 250,522 | 253,463 | 2,941 | 1.2% | 30,814 | 13.8% | 1.3% | 13,314 | 1,900 | 15,637 |
| Northwest | Kansas City, MO-KS MSA | Clinton | 20,740 | 20,434 | 20,553 | 119 | 0.6% | -187 | -0.9% | -0.1% | -226 | -27 | 61 |
| Central | Jefferson City, MO MSA | Cole | 76,145 | 76,774 | 76,191 | -583 | -0.8% | 46 | 0.1% | 0.0% | 2,494 | 820 | -3,246 |
| Central | Columbia, MO MSA | Cooper | 17,601 | 17,563 | 17,102 | -461 | -2.6% | -499 | -2.8% | -0.3% | 49 | 56 | -588 |
| Central | Nonmetro | Crawford | 24,631 | 23,856 | 23,739 | -117 | -0.5% | -892 | -3.6% | -0.4% | -229 | -26 | -629 |
| Southwest | Nonmetro | Dade | 7,839 | 7,547 | 7,568 | 21 | 0.3% | -271 | -3.5% | -0.4% | -357 | 20 | 63 |
| Ozark | Springfield, MO MSA | Dallas | 16,723 | 16,984 | 17,219 | 235 | 1.4% | 496 | 3.0% | 0.3% | 162 | 87 | 246 |
| Northwest | Nonmetro | Daviess | 8,444 | 8,273 | 8,283 | 10 | 0.1% | -161 | -1.9% | -0.2% | 286 | 9 | -454 |
| Northwest | St. Joseph, MO-KS MSA | DeKalb | 12,899 | 10,802 | 10,944 | 142 | 1.3% | -1,955 | -15.2% | -1.6% | -165 | 1 | -1,792 |
| Central | Nonmetro | Dent | 15,739 | 15,548 | 15,481 | -67 | -0.4% | -258 | -1.6% | -0.2% | -241 | 73 | -83 |
| South Central | Nonmetro | Douglas | 13,652 | 13,248 | 13,344 | 96 | 0.7% | -308 | -2.3% | -0.2% | -231 | -28 | -46 |
| Southeast | Nonmetro | Dunklin | 31,951 | 29,173 | 28,878 | -295 | -1.0% | -3,073 | -9.6% | -1.0% | -194 | 264 | -3,161 |
| St. Louis | St. Louis, MO- IL MSA | Franklin | 101,424 | 103,860 | 104,469 | 609 | 0.6% | 3,045 | 3.0% | 0.3% | 2,096 | 157 | 852 |
| Central | Nonmetro | Gasconade | 15,207 | 14,671 | 14,566 | -105 | -0.7% | -641 | -4.2% | -0.4% | -519 | 7 | -117 |
| Northwest | Nonmetro | Gentry | 6,749 | 6,564 | 6,484 | -80 | -1.2% | -265 | -3.9% | -0.4% | 0 | 14 | -277 |
| Ozark | Springfield, MO MSA | Greene | 275,320 | 293,499 | 294,997 | 1,498 | 0.5% | 19,677 | 7.1% | 0.7% | 7,003 | 3,053 | 9,643 |
| Northwest | Nonmetro | Grundy | 10,254 | 9,780 | 9,595 | -185 | -1.9% | -659 | -6.4% | -0.7% | 149 | 92 | -897 |
| Northwest | Nonmetro | Harrison | 8,968 | 8,346 | 8,321 | -25 | -0.3% | -647 | -7.2% | -0.7% | -116 | -6 | -523 |
| West Central | Nonmetro | Henry | 22,265 | 21,971 | 22,076 | 105 | 0.5% | -189 | -0.8% | -0.1% | -481 | -20 | 329 |
| West Central | Nonmetro | Hickory | 9,646 | 9,496 | 9,586 | 90 | 0.9% | -60 | -0.6% | -0.1% | -748 | -3 | 693 |
| Northwest | Nonmetro | Holt | 4,915 | 4,387 | 4,232 | -155 | -3.5% | -683 | -13.9% | -1.5% | -135 | 0 | -551 |
| Central | Columbia, MO MSA | Howard | 10,141 | 9,982 | 10,001 | 19 | 0.2% | -140 | -1.4% | -0.1% | 124 | 41 | -306 |
| South Central | Nonmetro | Howell | 40,544 | 40,084 | 40,262 | 178 | 0.4% | -282 | -0.7% | -0.1% | -61 | 90 | -278 |
| Southeast | Nonmetro | Iron | 10,591 | 10,152 | 10,098 | -54 | -0.5% | -493 | -4.7% | -0.5% | -454 | 27 | -64 |
| Kansas City | Kansas City, MO-KS MSA | Jackson | 674,854 | 704,350 | 705,925 | 1,575 | 0.2% | 31,071 | 4.6% | 0.5% | 30,383 | 8,279 | -7,133 |
| Southwest | Joplin, MO MSA | Jasper | 117,662 | 121,228 | 121,648 | 420 | 0.3% | 3,986 | 3.4% | 0.3% | 4,558 | 1,217 | -1,736 |
| St. Louis | St. Louis, MO- IL MSA | Jefferson | 219,130 | 225,402 | 226,543 | 1,141 | 0.5% | 7,413 | 3.4% | 0.3% | 5,753 | 649 | 1,159 |
| West Central | Nonmetro | Johnson | 52,689 | 54,187 | 54,219 | 32 | 0.1% | 1,530 | 2.9% | 0.3% | 3,038 | 1,060 | -2,596 |
| Northeast | Nonmetro | Knox | 4,125 | 3,957 | 3,940 | -17 | -0.4% | -185 | -4.5% | -0.5% | 49 | 0 | -236 |
| Central | Nonmetro | Laclede | 35,697 | 35,869 | 35,895 | 26 | 0.1% | 198 | 0.6% | 0.1% | 644 | 29 | -472 |
| West Central | Kansas City, MO-KS MSA | Lafayette | 33,380 | 32,774 | 33,006 | 232 | 0.7% | -374 | -1.1% | -0.1% | -29 | 18 | -357 |
| Southwest | Nonmetro | Lawrence | 38,590 | 38,288 | 38,175 | -113 | -0.3% | -415 | -1.1% | -0.1% | 363 | -97 | -668 |
| Northeast | Nonmetro | Lewis | 10,206 | 9,787 | 9,810 | 23 | 0.2% | -396 | -3.9% | -0.4% | 28 | 3 | -427 |
| Northeast | St. Louis, MO- IL MSA | Lincoln | 52,673 | 59,040 | 60,119 | 1,079 | 1.8% | 7,446 | 14.1% | 1.3% | 2,843 | 60 | 4,574 |
| Northwest | Nonmetro | Linn | 12,774 | 11,906 | 11,830 | -76 | -0.6% | -944 | -7.4% | -0.8% | -353 | 35 | -621 |
| Northwest | Nonmetro | Livingston | 15,128 | 14,982 | 14,413 | -569 | -3.8% | -715 | -4.7% | -0.5% | -290 | 53 | -480 |
| Southwest | Nonmetro | McDonald | 23,071 | 22,912 | 22,900 | -12 | -0.1% | -171 | -0.7% | -0.1% | 997 | 417 | -1,589 |
| Northeast | Nonmetro | Macon | 15,580 | 15,111 | 15,095 | -16 | -0.1% | -485 | -3.1% | -0.3% | -231 | 68 | -318 |
| Southeast | Nonmetro | Madison | 12,197 | 12,118 | 12,113 | -5 | 0.0% | -84 | -0.7% | -0.1% | -278 | 37 | 159 |
| Central | Nonmetro | Maries | 9,159 | 8,751 | 8,795 | 44 | 0.5% | -364 | -4.0% | -0.4% | -196 | 42 | -208 |
| Northeast | Nonmetro | Marion | 28,785 | 28,543 | 28,423 | -120 | -0.4% | -362 | -1.3% | -0.1% | 321 | 148 | -808 |
| Northwest | Nonmetro | Mercer | 3,770 | 3,619 | 3,558 | -61 | -1.7% | -212 | -5.6% | -0.6% | 13 | 20 | -243 |
| Central | Nonmetro | Miller | 24,701 | 25,607 | 25,791 | 184 | 0.7% | 1,090 | 4.4% | 0.4% | 232 | -19 | 900 |
| Southeast | Nonmetro | Mississippi | 14,333 | 13,208 | 12,691 | -517 | -3.9% | -1,642 | -11.5% | -1.2% | -193 | -14 | -1,428 |
| Central | Jefferson City, MO MSA | Moniteau | 15,630 | 15,816 | 15,585 | -231 | -1.5% | -45 | -0.3% | 0.0% | 542 | 76 | -653 |
| Northeast | Nonmetro | Monroe | 8,787 | 8,627 | 8,672 | 45 | 0.5% | -115 | -1.3% | -0.1% | -39 | 0 | -73 |
| Northeast | Nonmetro | Montgomery | 12,209 | 11,472 | 11,294 | -178 | -1.6% | -915 | -7.5% | -0.8% | -280 | 35 | -676 |
| Central | Nonmetro | Morgan | 20,542 | 20,720 | 20,716 | -4 | 0.0% | 174 | 0.8% | 0.1% | -378 | -6 | 561 |
| Southeast | Nonmetro | New Madrid | 18,928 | 17,052 | 16,693 | -359 | -2.1% | -2,235 | -11.8% | -1.2% | -192 | 4 | -2,052 |
| Southwest | Joplin, MO MSA | Newton | 58,172 | 58,329 | 58,451 | 122 | 0.2% | 279 | 0.5% | 0.0% | 835 | 149 | -683 |
| Northwest | Nonmetro | Nodaway | 23,402 | 22,089 | 21,743 | -346 | -1.6% | -1,659 | -7.1% | -0.7% | 249 | 153 | -2,077 |
| South Central | Nonmetro | Oregon | 10,934 | 10,517 | 10,411 | -106 | -1.0% | -523 | -4.8% | -0.5% | -184 | 0 | -334 |
| Central | Jefferson City, MO MSA | Osage | 13,907 | 13,621 | 13,535 | -86 | -0.6% | -372 | -2.7% | -0.3% | 169 | 7 | -550 |
| South Central | Nonmetro | Ozark | 9,746 | 9,155 | 9,083 | -72 | -0.8% | -663 | -6.8% | -0.7% | -436 | -11 | -206 |
| Southeast | Nonmetro | Pemiscot | 18,260 | 15,864 | 15,600 | -264 | -1.7% | -2,660 | -14.6% | -1.6% | 272 | -23 | -2,919 |
| Southeast | Nonmetro | Perry | 18,931 | 19,164 | 19,194 | 30 | 0.2% | 263 | 1.4% | 0.1% | 203 | 91 | -14 |
| West Central | Nonmetro | Pettis | 42,263 | 42,417 | 42,490 | 73 | 0.2% | 227 | 0.5% | 0.1% | 1,440 | 415 | -1,608 |
| Central | Nonmetro | Phelps | 45,298 | 44,593 | 44,414 | -179 | -0.4% | -884 | -2.0% | -0.2% | 491 | 1,925 | -3,330 |
| Northeast | Nonmetro | Pike | 18,474 | 17,678 | 17,552 | -126 | -0.7% | -922 | -5.0% | -0.5% | 171 | 18 | -1,111 |
| Kansas City | Kansas City, MO-KS MSA | Platte | 89,714 | 104,726 | 106,532 | 1,806 | 1.7% | 16,818 | 18.7% | 1.7% | 5,116 | 2,094 | 9,620 |
| Ozark | Springfield, MO MSA | Polk | 31,158 | 32,228 | 32,490 | 262 | 0.8% | 1,332 | 4.3% | 0.4% | 316 | -3 | 1,034 |
| Central | Nonmetro | Pulaski | 52,865 | 52,634 | 52,709 | 75 | 0.1% | -156 | -0.3% | 0.0% | 4,727 | 2,480 | -7,458 |
| Northwest | Nonmetro | Putnam | 4,974 | 4,688 | 4,688 | 0 | 0.0% | -286 | -5.7% | -0.6% | -105 | -2 | -175 |
| Northeast | Nonmetro | Ralls | 10,196 | 10,292 | 10,299 | 7 | 0.1% | 103 | 1.0% | 0.1% | 21 | 0 | 83 |
| Northeast | Nonmetro | Randolph | 25,454 | 24,839 | 24,409 | -430 | -1.7% | -1,045 | -4.1% | -0.4% | 48 | 46 | -1,141 |
| Kansas City | Kansas City, MO-KS MSA | Ray | 23,517 | 23,024 | 22,915 | -109 | -0.5% | -602 | -2.6% | -0.3% | -56 | 12 | -562 |
| South Central | Nonmetro | Reynolds | 6,676 | 6,288 | 6,198 | -90 | -1.4% | -478 | -7.2% | -0.7% | -252 | 0 | -223 |
| South Central | Nonmetro | Ripley | 14,102 | 13,343 | 13,300 | -43 | -0.3% | -802 | -5.7% | -0.6% | -188 | -13 | -591 |
| St. Louis | St. Louis, MO- IL MSA | St. Charles | 361,808 | 401,625 | 406,204 | 4,579 | 1.1% | 44,396 | 12.3% | 1.2% | 17,142 | 4,604 | 22,769 |
| West Central | Nonmetro | St. Clair | 9,823 | 9,450 | 9,689 | 239 | 2.5% | -134 | -1.4% | -0.1% | -471 | 3 | 342 |
| Southeast | Nonmetro | Ste. Genevieve | 18,126 | 17,957 | 17,924 | -33 | -0.2% | -202 | -1.1% | -0.1% | -74 | 137 | -263 |
| Southeast | Nonmetro | St. Francois | 65,534 | 66,942 | 66,485 | -457 | -0.7% | 951 | 1.5% | 0.1% | -566 | 17 | 1,520 |
| St. Louis | St. Louis, MO- IL MSA | St. Louis | 998,846 | 995,467 | 994,020 | -1,447 | -0.1% | -4,826 | -0.5% | 0.0% | 16,114 | 20,311 | -41,041 |
| West Central | Nonmetro | Saline | 23,422 | 22,827 | 22,858 | 31 | 0.1% | -564 | -2.4% | -0.2% | 199 | 478 | -1,239 |
| Northeast | Nonmetro | Schuyler | 4,441 | 4,632 | 4,534 | -98 | -2.1% | 93 | 2.1% | 0.2% | 136 | 11 | -53 |
| Northeast | Nonmetro | Scotland | 4,841 | 4,936 | 4,871 | -65 | -1.3% | 30 | 0.6% | 0.1% | 250 | -2 | -217 |
| Southeast | Nonmetro | Scott | 39,268 | 38,416 | 38,288 | -128 | -0.3% | -980 | -2.5% | -0.3% | 615 | 55 | -1,634 |
| South Central | Nonmetro | Shannon | 8,445 | 8,177 | 8,203 | 26 | 0.3% | -242 | -2.9% | -0.3% | -47 | 1 | -194 |
| Northeast | Nonmetro | Shelby | 6,364 | 5,923 | 5,919 | -4 | -0.1% | -445 | -7.0% | -0.7% | -76 | 10 | -377 |
| Southeast | Nonmetro | Stoddard | 30,025 | 29,096 | 29,001 | -95 | -0.3% | -1,024 | -3.4% | -0.3% | -414 | 9 | -593 |
| Ozark | Nonmetro | Stone | 32,241 | 32,002 | 32,465 | 463 | 1.4% | 224 | 0.7% | 0.1% | -1,444 | 26 | 1,676 |
| Northwest | Nonmetro | Sullivan | 6,737 | 6,061 | 6,033 | -28 | -0.5% | -704 | -10.4% | -1.1% | 107 | 168 | -986 |
| Ozark | Nonmetro | Taney | 51,905 | 56,057 | 56,104 | 47 | 0.1% | 4,199 | 8.1% | 0.8% | 656 | 296 | 3,261 |
| South Central | Nonmetro | Texas | 26,043 | 25,383 | 25,112 | -271 | -1.1% | -931 | -3.6% | -0.4% | -151 | 0 | -762 |
| West Central | Nonmetro | Vernon | 21,160 | 20,654 | 20,388 | -266 | -1.3% | -772 | -3.6% | -0.4% | -1 | 143 | -907 |
| Northeast | St. Louis, MO- IL MSA | Warren | 32,612 | 35,716 | 36,594 | 878 | 2.5% | 3,982 | 12.2% | 1.2% | 1,219 | 64 | 2,721 |
| Central | Nonmetro | Washington | 25,198 | 24,743 | 24,604 | -139 | -0.6% | -594 | -2.4% | -0.2% | 89 | 2 | -673 |
| South Central | Nonmetro | Wayne | 13,519 | 12,904 | 12,769 | -135 | -1.0% | -750 | -5.5% | -0.6% | -548 | -3 | -195 |
| Ozark | Springfield, MO MSA | Webster | 36,320 | 39,644 | 39,859 | 215 | 0.5% | 3,539 | 9.7% | 0.9% | 2,205 | 48 | 1,298 |
| Northwest | Nonmetro | Worth | 2,152 | 1,989 | 1,953 | -36 | -1.8% | -199 | -9.2% | -1.0% | -69 | 0 | -129 |
| South Central | Nonmetro | Wright | 18,777 | 18,329 | 18,325 | -4 | 0.0% | -452 | -2.4% | -0.2% | 46 | -29 | -463 |
| * Source: U.S. Census Bureau, Population Estimates Program, V2020 * The sum of the components of population change differs slightly from the 2010 to 2020 change because the Census Bureau does not include the residuals in the published components of change estimates |